Experiment Setup
We have set up a GamingAnywhere testbed in our lab. We conduct the experiments
using Windows 7 desktops with Intel 2.67 GHz i7 processors if not
otherwise specified. For evaluation purposes, we compare the performance
of GamingAnywhere against OnLive [
29] and StreamMyGame (SMG) [
34].
Figure
6 illustrates the experimental setup, which
consists of a server, a client, and a router. The OnLive server resides
in OnLive's data centers, while the GamingAnywhere and SMG servers are installed
on our own PCs. More specifically, the OnLive client connects to the
OnLive server over the Internet, while the GamingAnywhere and SMG clients connect
to their servers via a LAN. To evaluate the performance of the cloud
gaming systems under diverse network conditions, we add a FreeBSD router
between the client and server, and run
dummynet on it to inject
constraints of delays, packet losses, and network bandwidths.
Because the OnLive server is outside our LAN, the quality of the network
path between our OnLive client and the server might affect our
evaluations. However, according to our observations, the quality of the
path was consistently good throughout the experiments. The network delay
of the path was around 130 ms with few fluctuations. Furthermore, the
packet loss rates were measured to be less than 10
−6 when receiving
OnLive streams at the recommended 5 Mbps. Therefore, the path between
the OnLive server and our client can be considered as a communication
channel with sufficient bandwidth, zero packet loss rate, and a constant
130 ms latency.
Since the performance of cloud gaming systems may be game-dependent, we
consider games from three popular categories: action adventure,
first-person shooter, and real-time strategy. We pick a representative
game from each category, and briefly introduce them in the following.
- LEGO Batman: The Videogame (Batman) [2] is
an action-adventure game, created by Traveller's Tales in 2008. All the
interactive objects in this game are made of Lego bricks.
In this game, players control the characters to fight enemies
and solve puzzles from a third-person perspective.
- F.E.A.R. 2: Project Origin (FEAR) [1] is a
first-person shooter game, developed by Monolith Productions in 2009.
The combat scenes are designed to be as close to those in real life as
possible. In this game, players have great freedom to interact with the
environments, e.g., they can flip over a desk to take cover.
- Warhammer 40,000: Dawn of War II (DOW) [3] is a
real-time strategy game developed by Relic Entertainment in 2009. In the
campaign mode, players control squads to fight against enemies and
destroy the buildings. In the multiplayer mode, up to 8 players play
matches on the same map to complete a mission, such as holding specific
positions.
Modern video encoders strive to achieve the highest video
quality with the smallest bit rate by applying complex coding
techniques. However, overly-complex coding techniques are not
feasible for real-time videos given their lengthy encoding
time. As such, we empirically study the tradeoff among the bit
rate, video quality, and frame complexity using
x264.
More specifically, we apply the real-time encoding parameters
summarized in Appendix , and exercise a wide
spectrum of other encoding parameters. We then analyze the
resulting video quality and encoding time. Based on our
analysis, we recommend the following
x264 encoding
parameters:
--profile main --preset faster --tune zerolatency
--bitrate $r --ref 1 --me dia --merange 16
--intra-refresh --keyint 48 --sliced-threads
--slices 4 --threads 4 --input-res 1280x720,
where
$r is the encoding rate.
We configure the GamingAnywhere server to use the above-mentioned encoding
parameters,
and we set the encoding bit rate to be 3 Mbps. For a fair comparison,
all games are streamed at a resolution of 720p. Whereas we configure
GamingAnywhere and OnLive to stream at 50 fps, StreamMyGame only supports
streaming at 25 fps. We design the experiments to evaluate the three
gaming systems from two critical aspects:
responsiveness and
video quality. We also conduct experiments to quantify the
network loads incurred by different cloud gaming systems. The details of
the experimental designs and results are given in the rest of this
section.
6.2 Responsiveness
We define response delay (RD) to be the time difference between a user
submitting a command and the corresponding in-game action appearing on
the screen. Studies [
8,
17,
46] report that players of
various game categories can tolerate different degrees of RD; for
example, it was observed that first-person shooter game players demand
for less than 100 ms RD [
8]. However, since measuring RD in
cloud gaming systems is not an easy task (as discussed in
Section
2.2), we adopt the RD measurement procedure
proposed in [
5], in which the RD is divided into three
components:
- Processing delay (PD) is the time required for the server to
receive and process a player's command, and to encode and transmit the
corresponding frame to that client.
- Playout delay (OD) is the time required for the client to receive,
decode, and render a frame on the display.
- Network delay (ND) is the time required for a round
of data exchange between the server and client. ND is also
known as round-trip time (RTT).
Therefore, we have
RD=
PD+
OD+
ND.
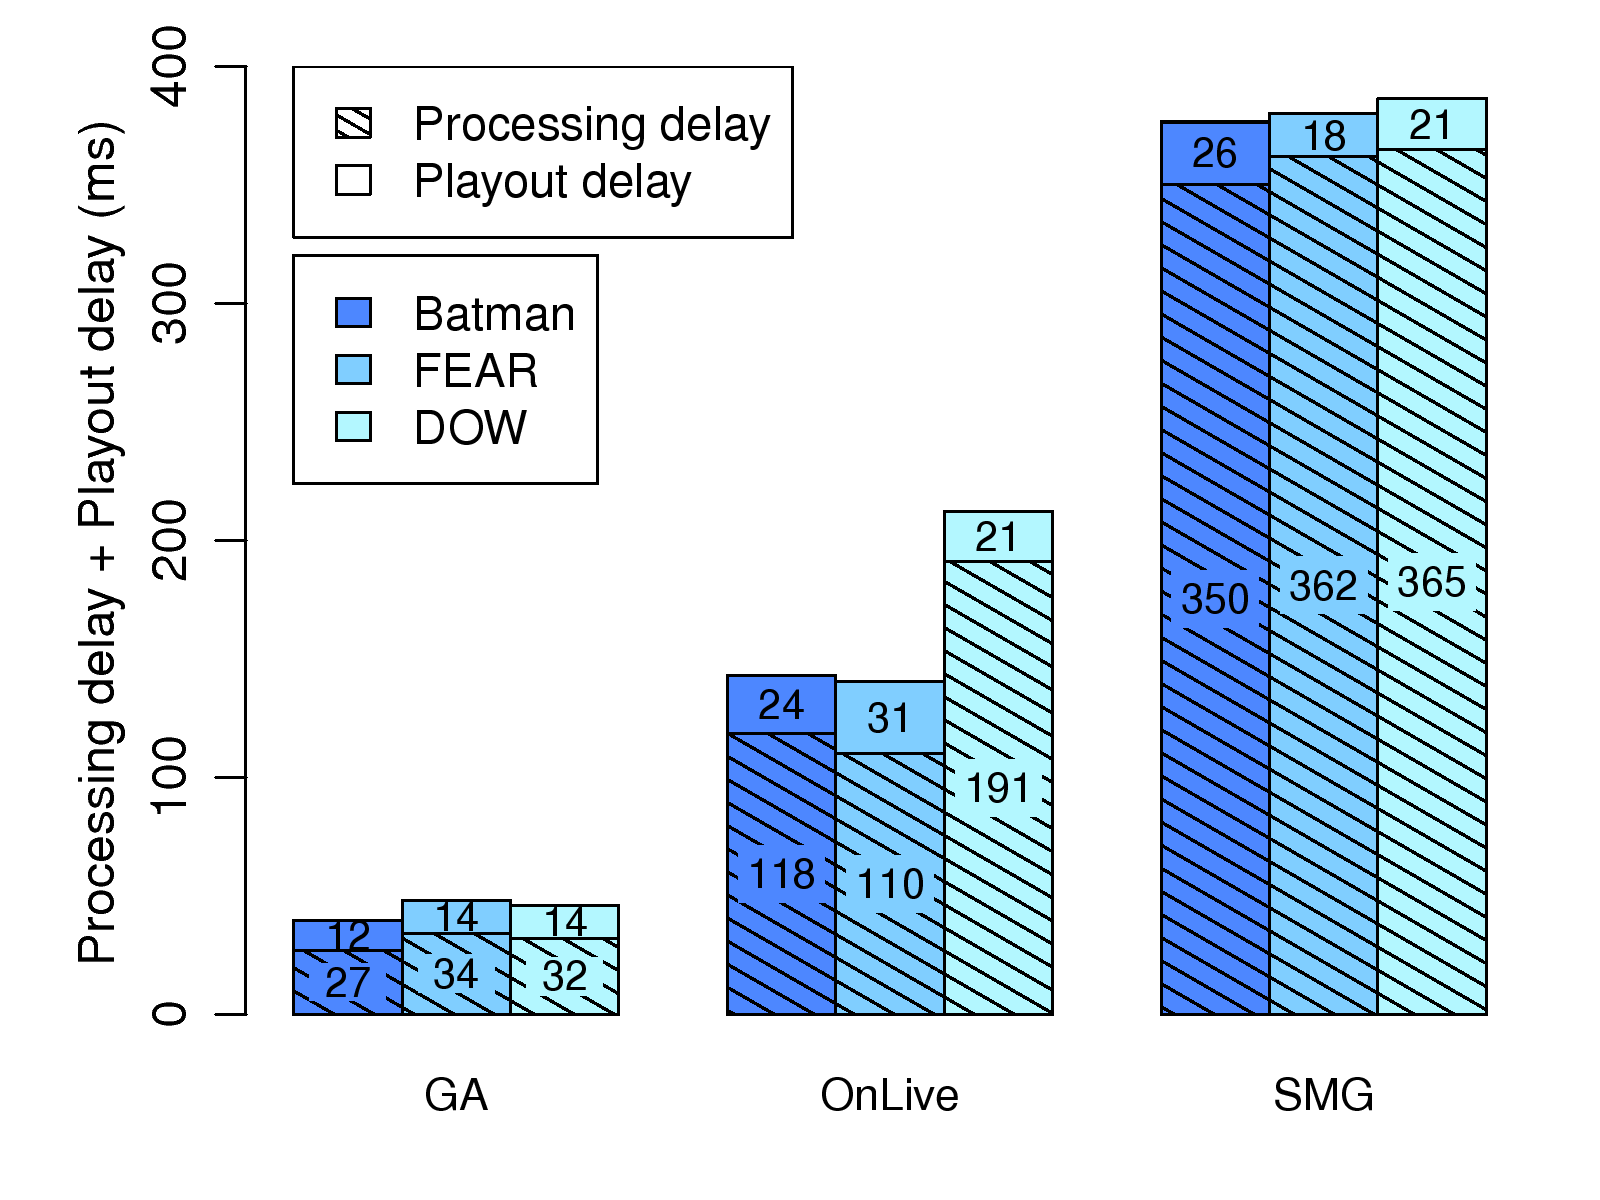
Figure 7: Response delays of GamingAnywhere, OnLive, and StreamMyGame.
ND can be measured using probing packets, e.g., in
ICMP
protocol, and is not controllable by cloud gaming systems.
Moreover, ND in a LAN is much smaller than that in the
Internet. Therefore, for a fair comparison among the cloud
gaming systems, we exclude ND from RD measurements in the rest
of this paper. Measuring PD (at the server) and OD (at the
client) is much more challenging, because they occur internally
in the cloud gaming systems, which may be closed and
proprietary. The procedure detailed in [
5] measures
the PD and OD using external probes only, and thus works for
all the considered cloud gaming systems.
For GamingAnywhere, we further divide the PD and OD into subcomponents by
instrumenting the server and client. More specifically, PD is divided
into: (i)
memory copy, which is the time for copying a raw image
out of the games, (ii)
format conversion, which is the time for
color-space conversion, (iii)
video encoding, which is the time
for video compression, and (iv)
packetization, which is the time
for segmenting each frame into one or multiple packets. OD is divided
into: (i)
frame buffering, which is the time for receiving all the
packets belonging to the current frame (ii)
video decoding, which
is the time for video decompression, and (iii)
screen rendering,
which is the time for displaying the decoded frame.
Results. Figure
7 reports the average PD (server)
and OD (client) achieved by the considered cloud gaming systems. From
this figure, we make several observations. First, the OD is small, ≤ 31 ms, for all cloud gaming systems and considered games. This reveals
that all the decoders are efficient, and the decoding time of different
games does not fluctuate too much. Second, GamingAnywhere achieves a much smaller
PD, at most 34 ms, than OnLive and SMG, which are observed to be as
high as 191 and 365 ms, respectively. This demonstrates the
efficiency of the proposed GamingAnywhere: the PDs of OnLive and SMG are 3+ and
10+ times longer than that of GamingAnywhere. Last, among the three systems,
only GamingAnywhere achieves sub-100 ms RD, and may satisfy the stringent delay
requirements of networked games [
8].
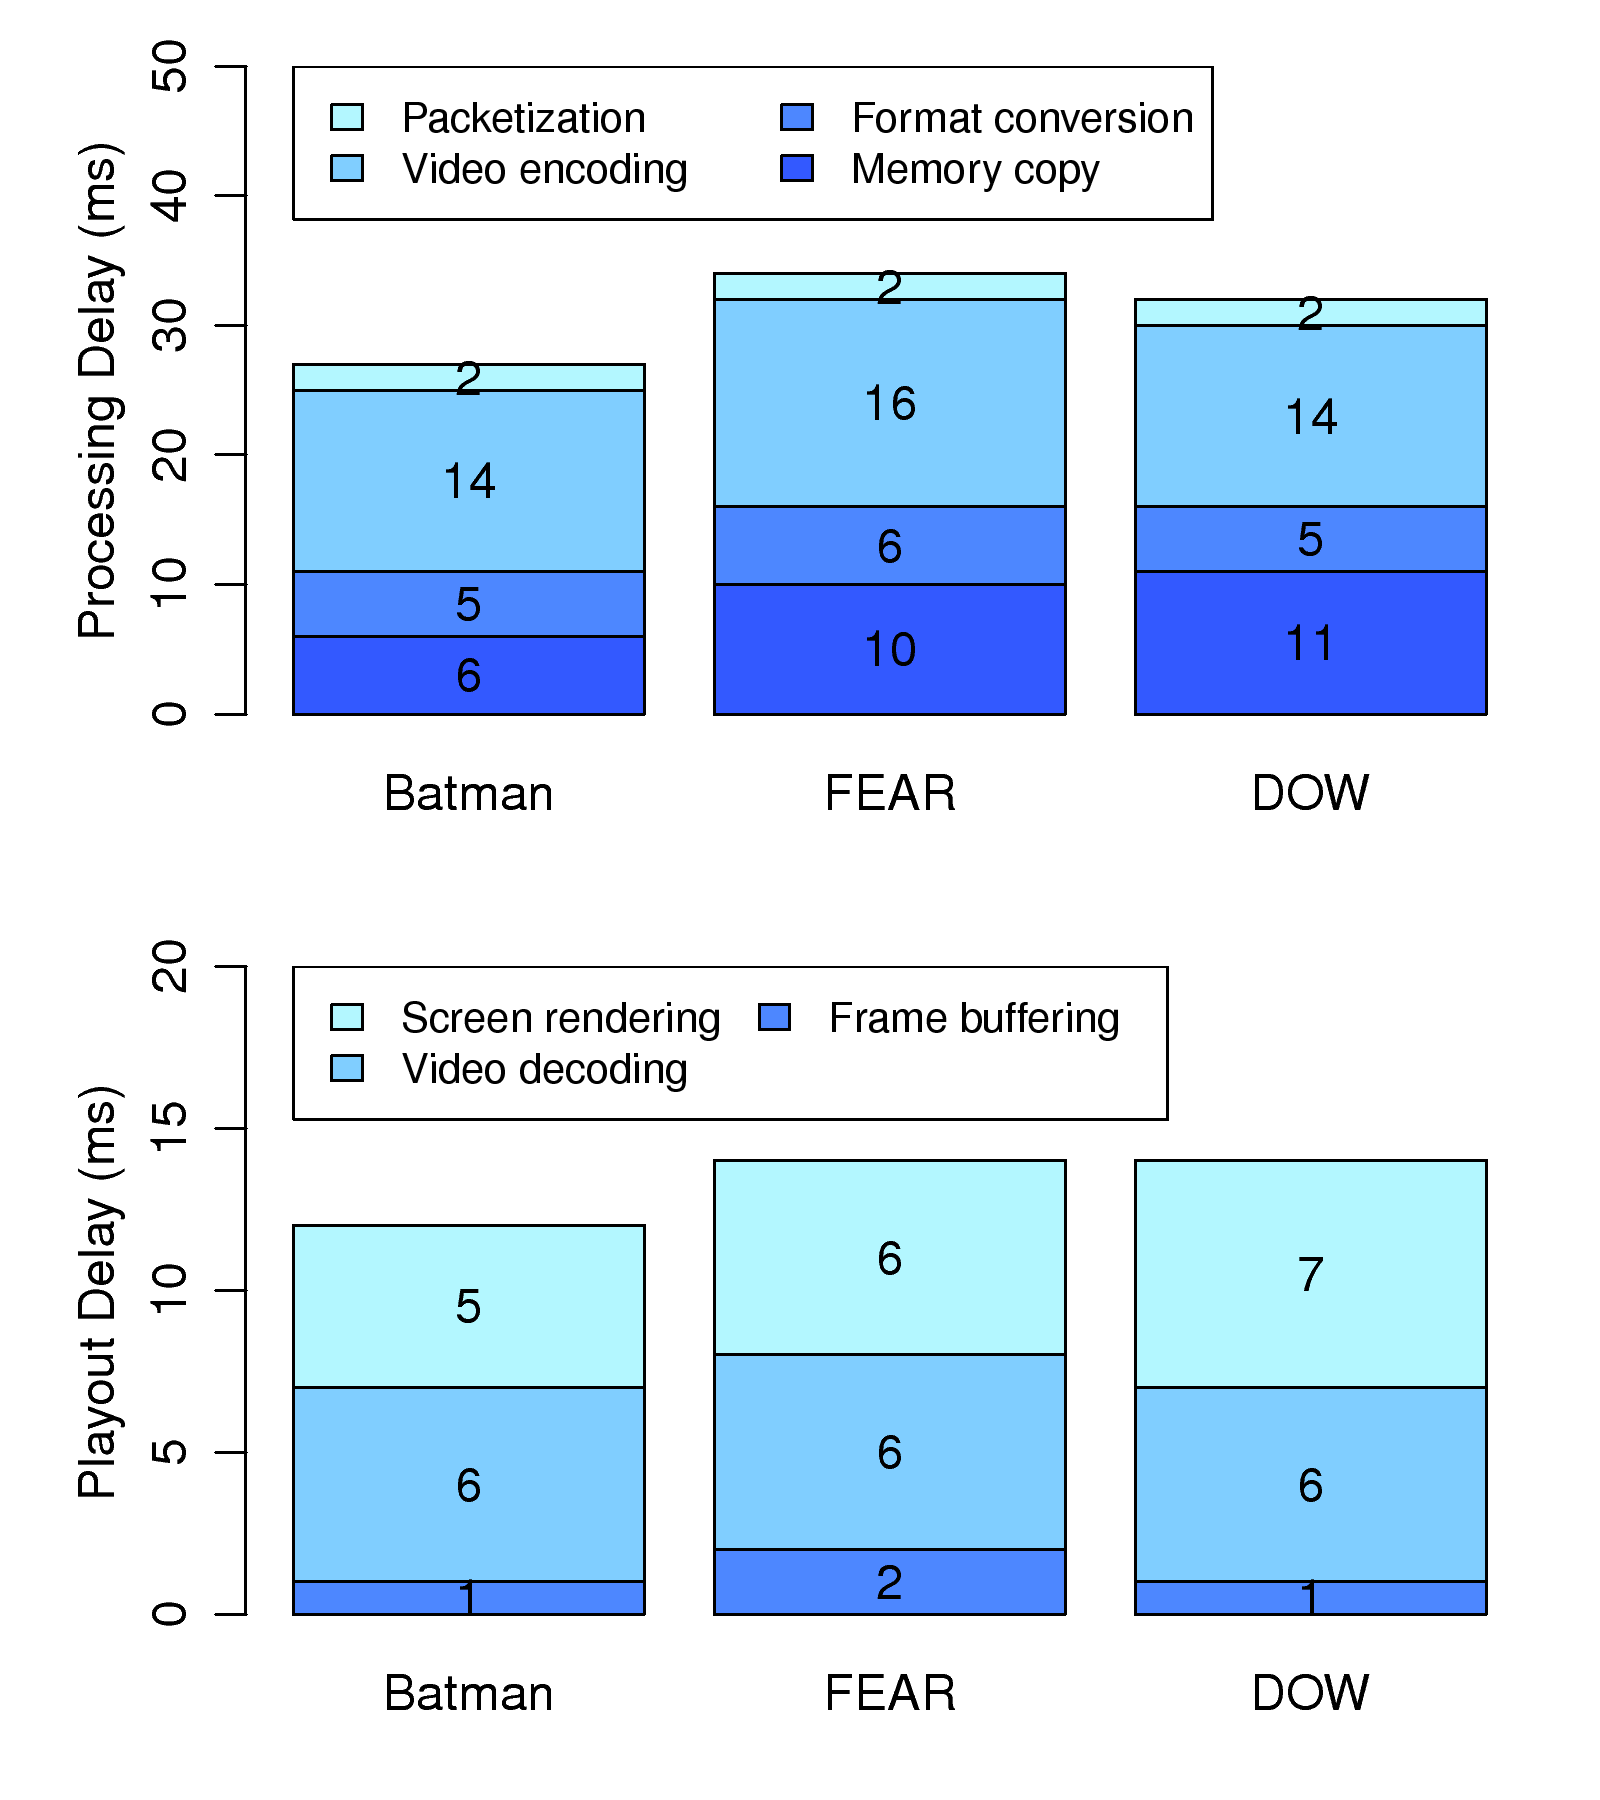
Figure 8: Delay decomposition of GamingAnywhere.
Figure
8 presents the decomposed delay
subcomponents of PD and OD. This figure reveals that the GamingAnywhere
server and client are well-tuned, in the sense that all the
steps in the pipeline are fairly efficient. Even for the most
time-consuming video encoding (at the server) and video
rendering (at the client), each frame is finished in at most
16 and 7 ms on average. Such a low delay contributes to the
superior RD of GamingAnywhere, compared to the other well-known cloud
gaming systems.
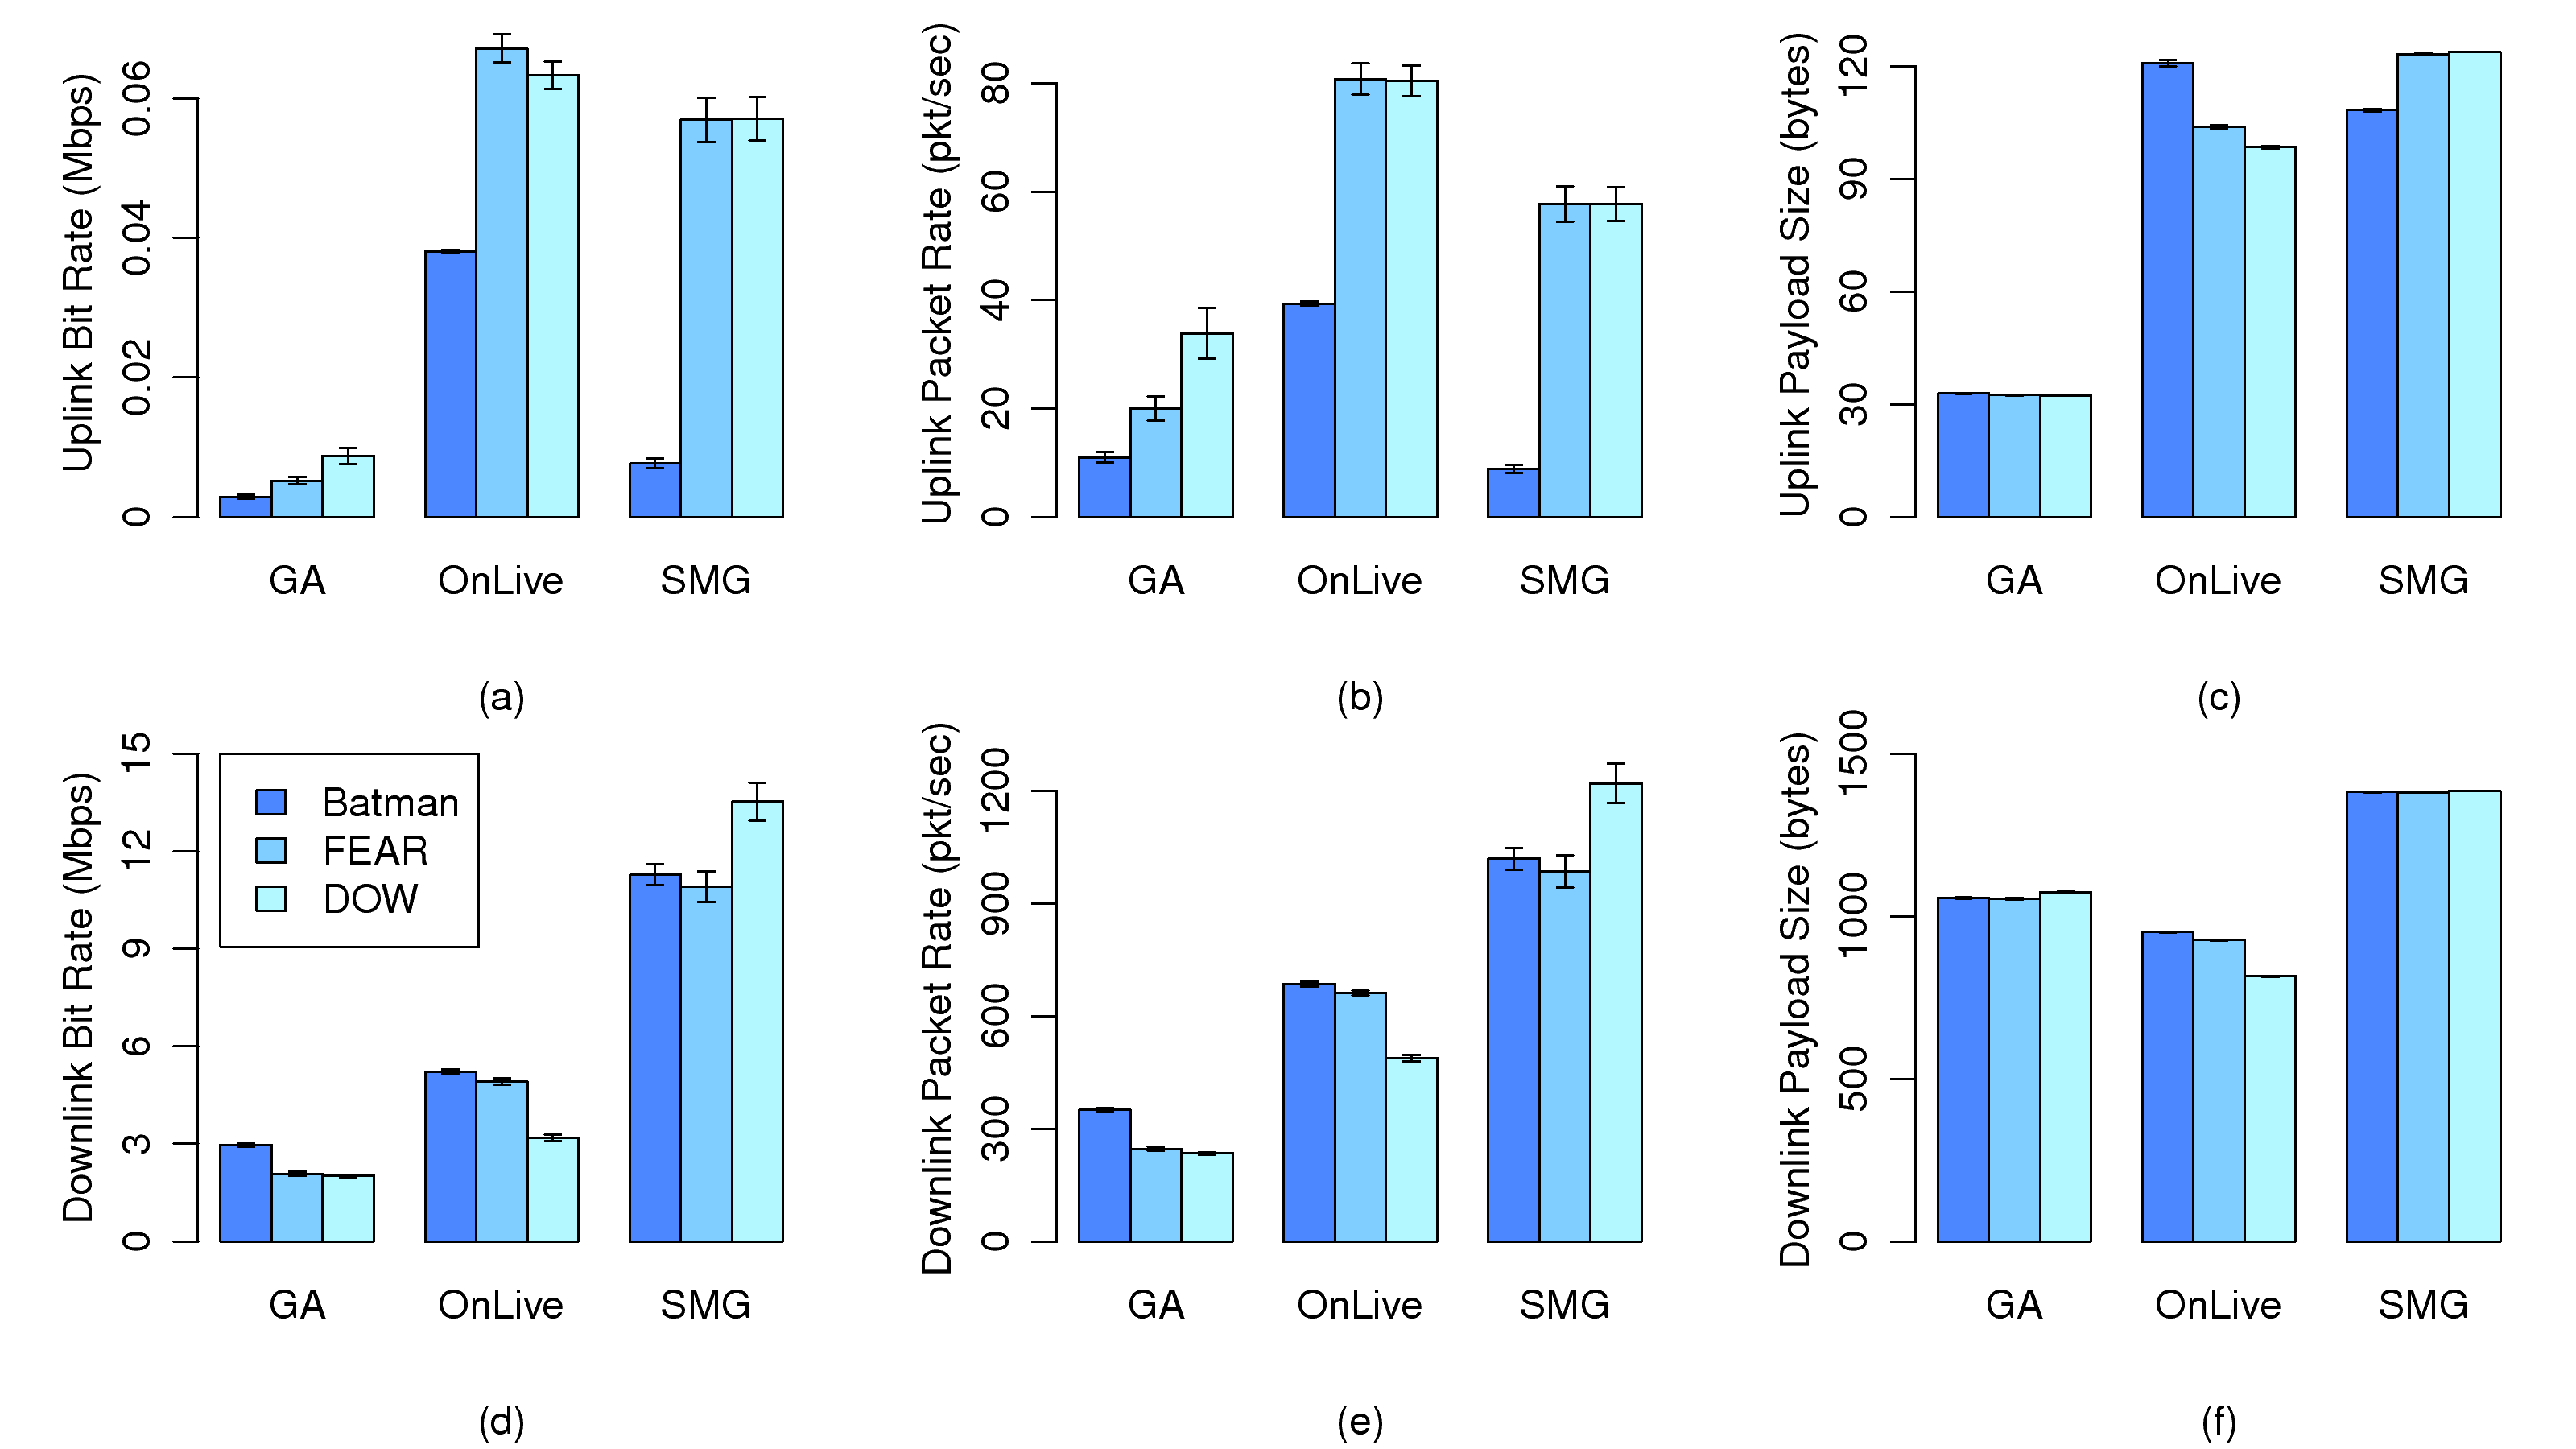
Figure 9: Network loads incurred by the considered cloud gaming systems.
6.3 Network Loads
We next quantify the network loads incurred by GamingAnywhere. In particular, we
recruit an experienced gamer, and ask him to play each game using
different cloud gaming systems. Every game session lasts for 10 minutes,
and the network packets are captured by
Wireshark. For a fair
comparison, the player is asked to follow two guidelines. First, he
shall visit as many areas as possible and fight the opponents as in
normal game plays. Second, he shall repeat his actions and trajectories
as much as possible.
Results. Figure
9 plots the uplink and
downlink traffic characteristics, including bit rate, packet
rate, and payload length. The bar charts show the average
values with 95% confidence intervals.
Figures
9(a)-
9(c) reveal
that the proposed GamingAnywhere incurs a much lower uplink traffic
loads, compared to OnLive and SMG. The only exception is that,
with Batman, SMG incurs lower uplink packet rate
(Figure
9(b)). However, SMG also produces a
larger uplink payload size (Figure
9(c)),
which leads to a higher uplink bit rate than that of GamingAnywhere
(Fig
9(a)).
Figures
9(d)-
9(f) reveal
that the downlink bit rates of OnLive are between 3-5 Mbps,
while those of SMG are between 10-13 Mbps. This finding
indicates that the compression algorithm employed by OnLive
achieves up to a 4.33 times higher compression rate, compared
to that of SMG.
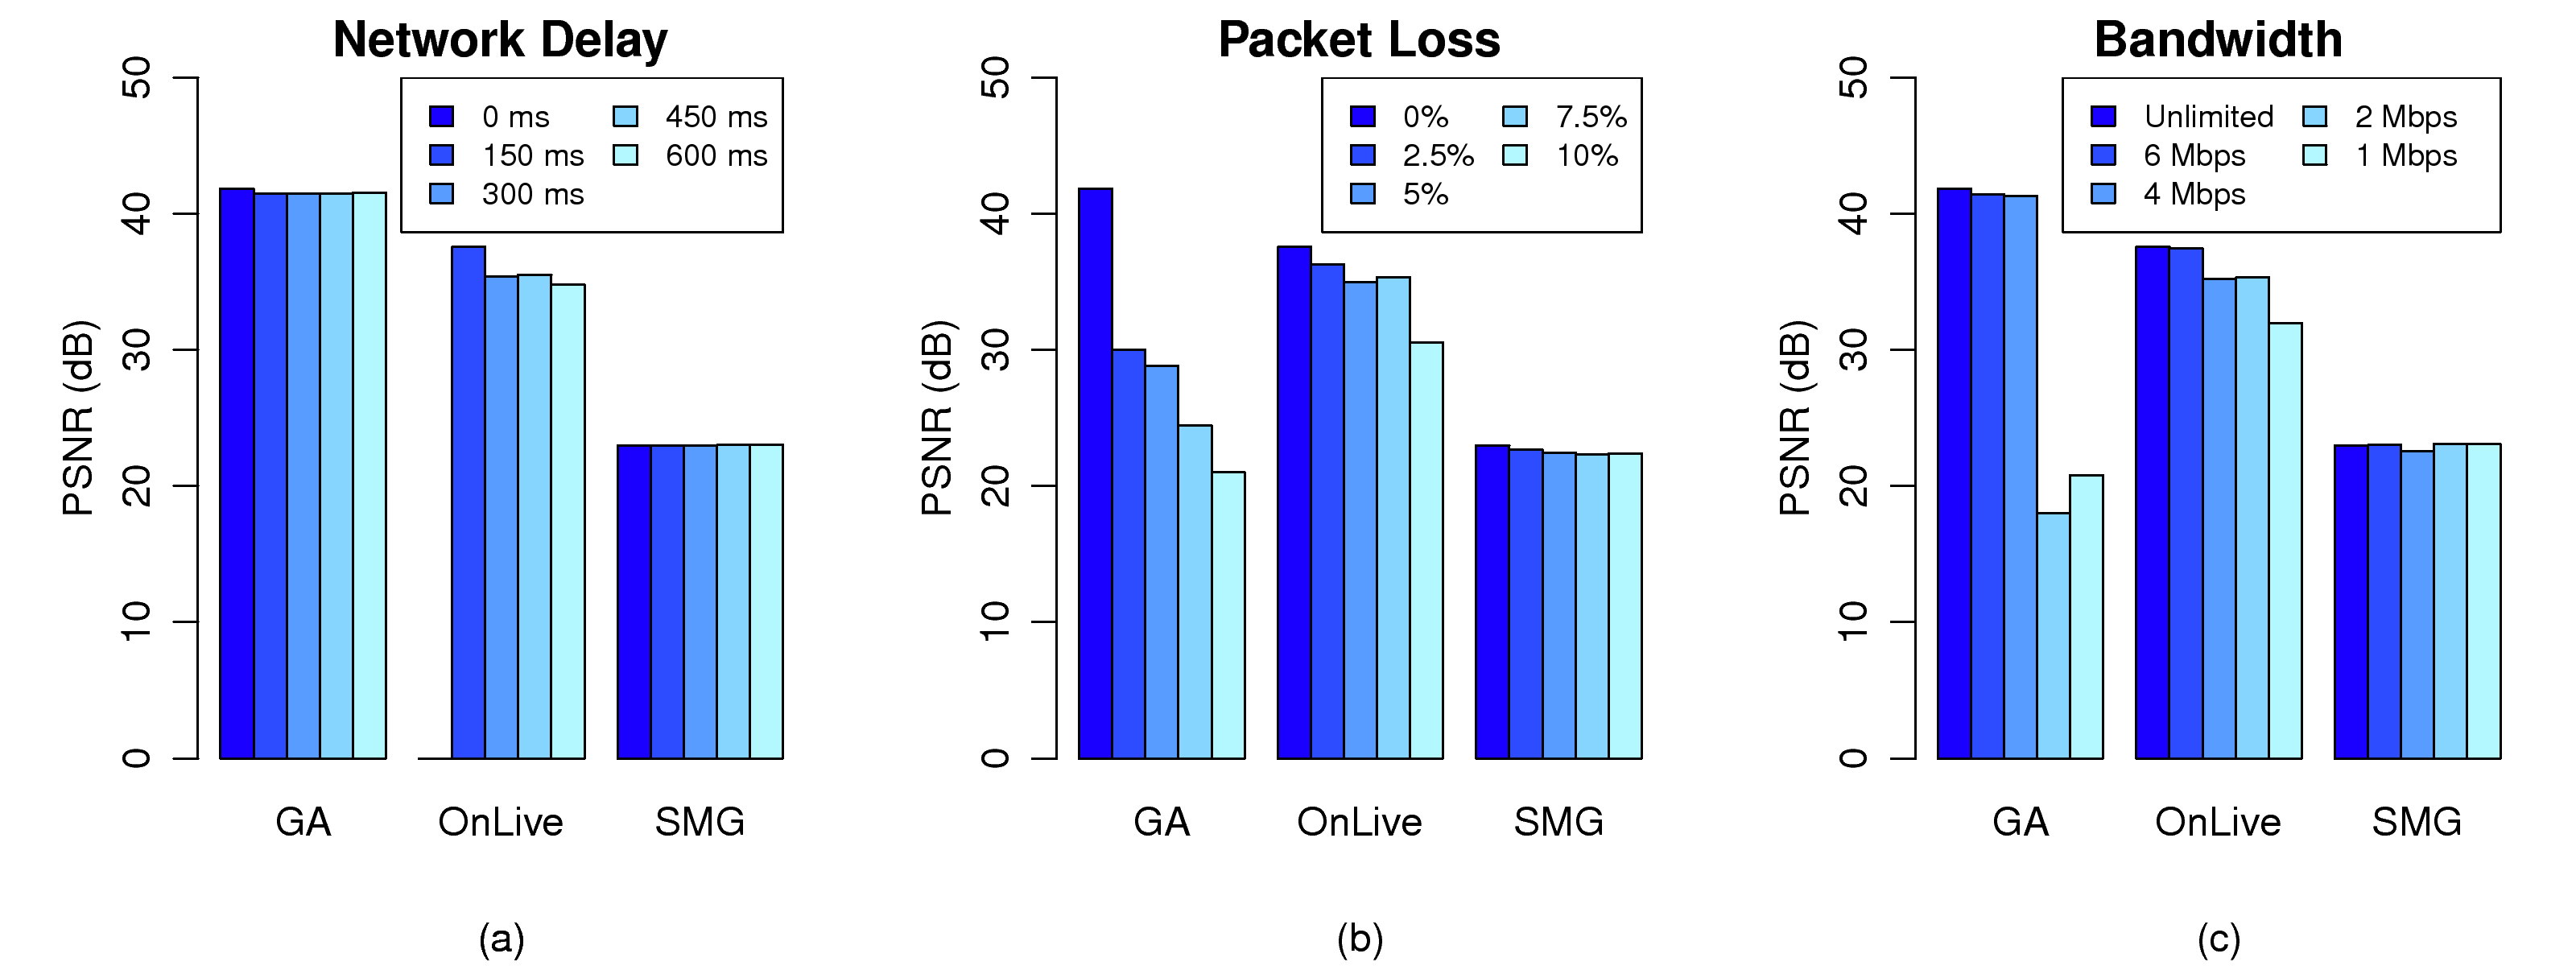
Figure 10: Achieved video quality in PSNR under different network conditions.
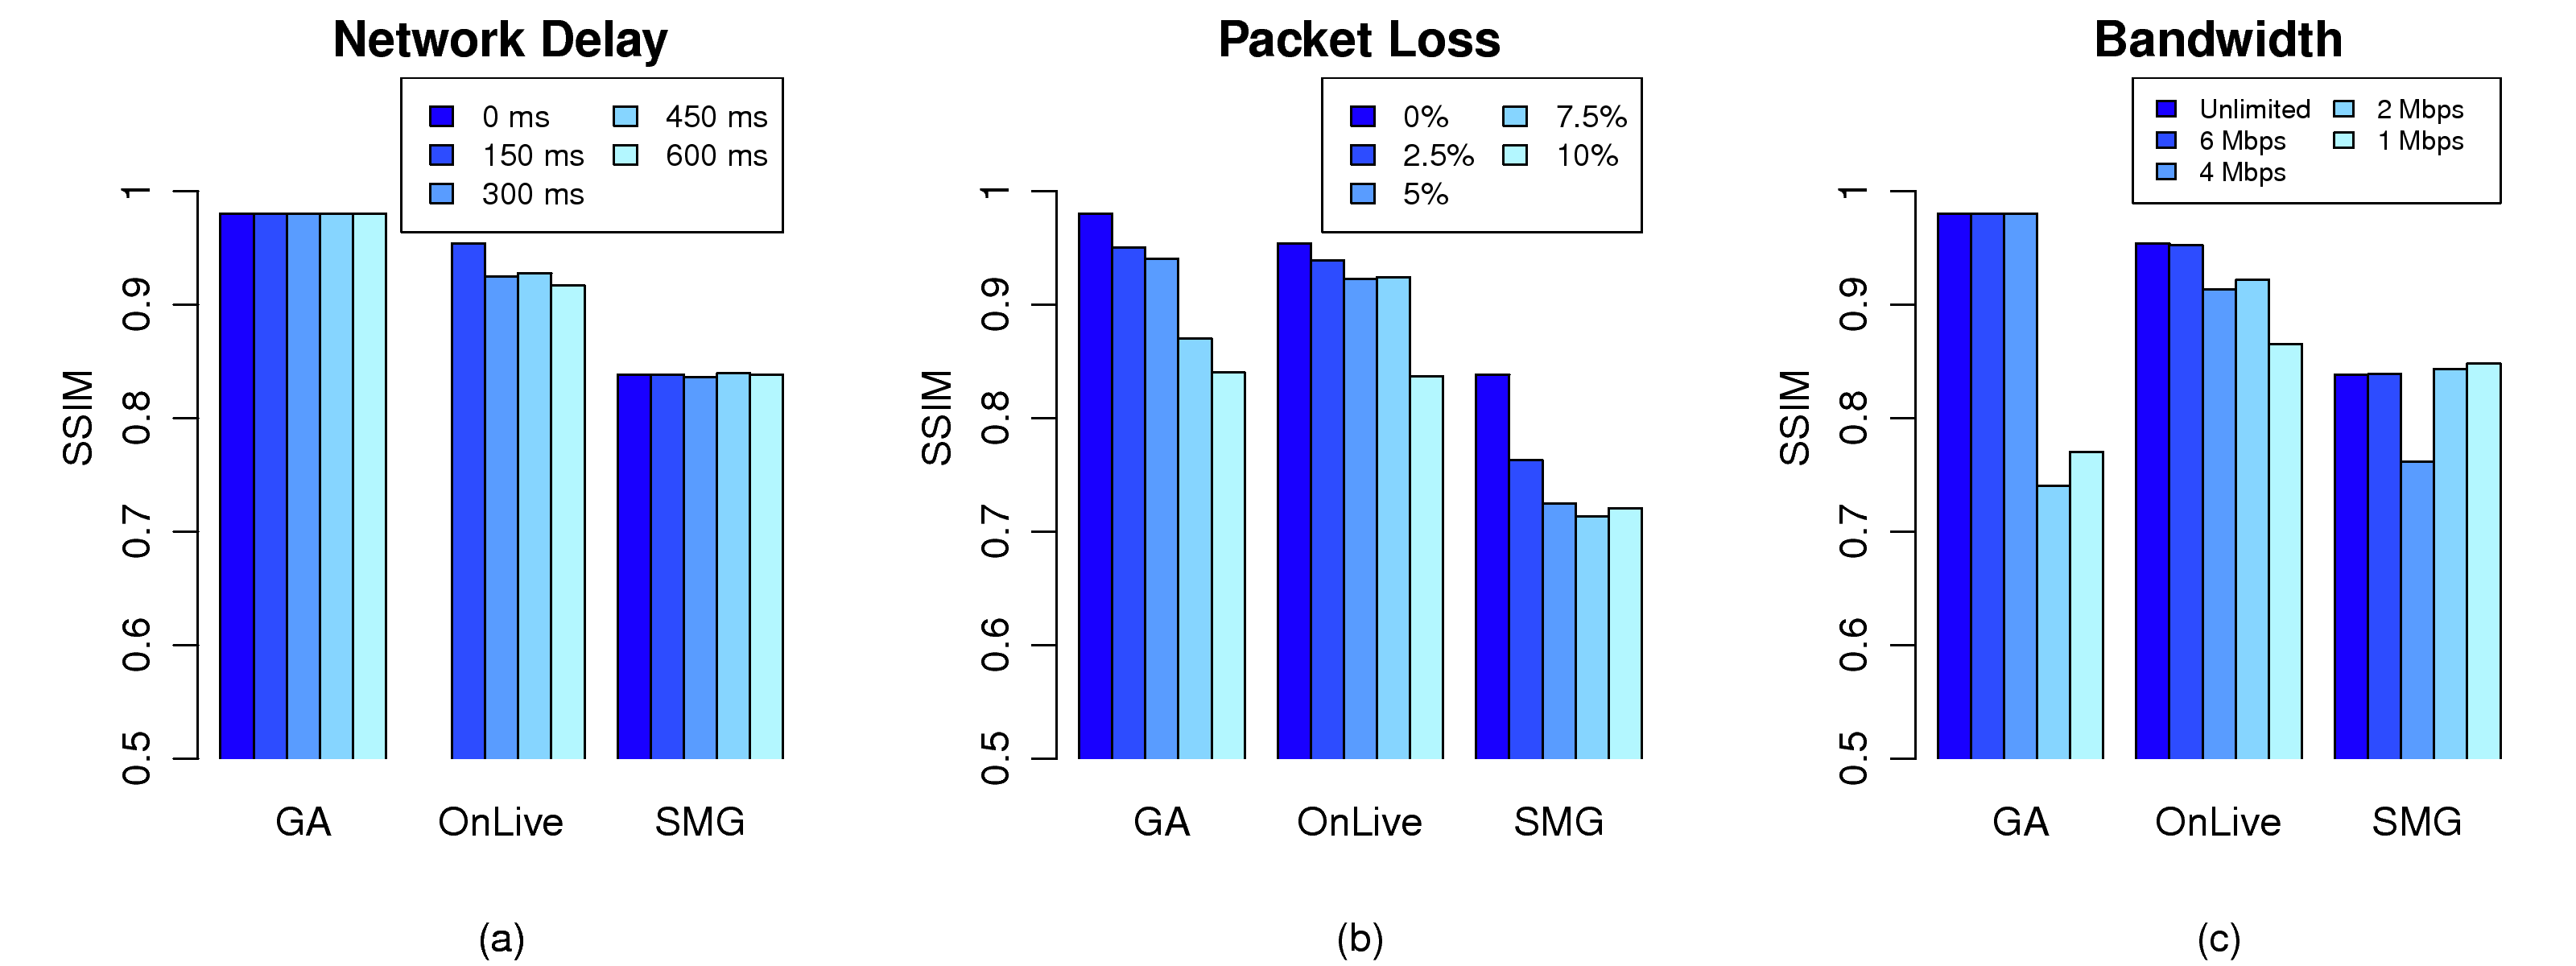
Figure 11: Achieved video quality in SSIM under different network conditions.
We can make another observation on
Figure
9(d): GamingAnywhere incurs a download bit rate
≤ 3 Mbps, which is also much lower than that of SMG.
However, given that we set the encoding bit rate at 3 Mbps,
the download bit rate should
never be smaller than that.
We took a closer look and found that, with GamingAnywhere, only Batman
achieves 50 fps; FEAR and DOW only achieve 35-42 fps, which
leads to lower download bit rate and may result in irregular
playouts. Our in-depth analysis shows that, unlike Batman, both
FEAR and DOW use
multisampling surfaces, which cannot be
locked for memory copy operations. More specifically, an
additional
non-multisampling surface and an extra copy
operation are required for FEAR and DOW, which in turn hurts
the achieved frame rates. As one of our future tasks, we will
optimize the multi-threaded design of the GamingAnywhere server, so as to
minimize the synchronization overhead.
In summary, we have shown that GamingAnywhere incurs much lower network traffic
loads. Even though the current GamingAnywhere implementation only achieves 35-42
fps for games using multisampling surfaces, such a frame rate is still
much higher than the 25 fps of SMG. On the other hand the slightly lower
achieved frame rate may affect the fairness of video quality comparisons
between GamingAnywhere and OnLive. Therefore, in the rest of this section, we only
report results from Batman.
6.4 Video Quality
Video streaming quality directly affects gaming experience, and network
conditions are the keys for high-quality streaming. In this light, we
use
dummynet to control three network condition metrics: network
delay (ND), packet loss rate, and network bandwidth. We vary ND between
0-600 ms, packet loss rate between 0-10%, and bandwidth 1-6 Mbps in
our experiments. We also include experiments with
unlimited
bandwidth. For OnLive, the ND in the Internet is already 130 ms and thus
we cannot report the results from zero ND. Two video quality metrics,
PSNR [
40,p. 29] and Structural Similarity (SSIM) [
41],
are adopted. We report the average PSNR and SSIM values of the
Y-component.
Results. Figures
10 and
11 present
the PSNR and SSIM values, respectively. We make four observations on
these two figures. First, ND does not affect the video quality too much
(Figures
10(a) and
11(a)). Second, GamingAnywhere
achieves much higher video quality than OnLive and SMG: up to 3 dB and
0.03, and 19 dB and 0.15 gaps are observed, respectively. Third, GamingAnywhere
suffers from quality drops when packet loss rate is nontrivial, as
illustrated in Figures
10(b) and
11(b).
This can be attributed to the missing error resilience mechanism in
GamingAnywhere. Nevertheless, high packet loss rates are less common in modern
networks. Last, Figures
10(c) and
11(c)
show that the video quality of GamingAnywhere suddenly drops when the bandwidth is
smaller than the encoding bit rate of 3 Mbps. A potential future work
to address this is to add a
rate adaptation heuristic to
dynamically adjust the encoding bit rate, in order to utilize all the
available bandwidth without overloading the networks.